
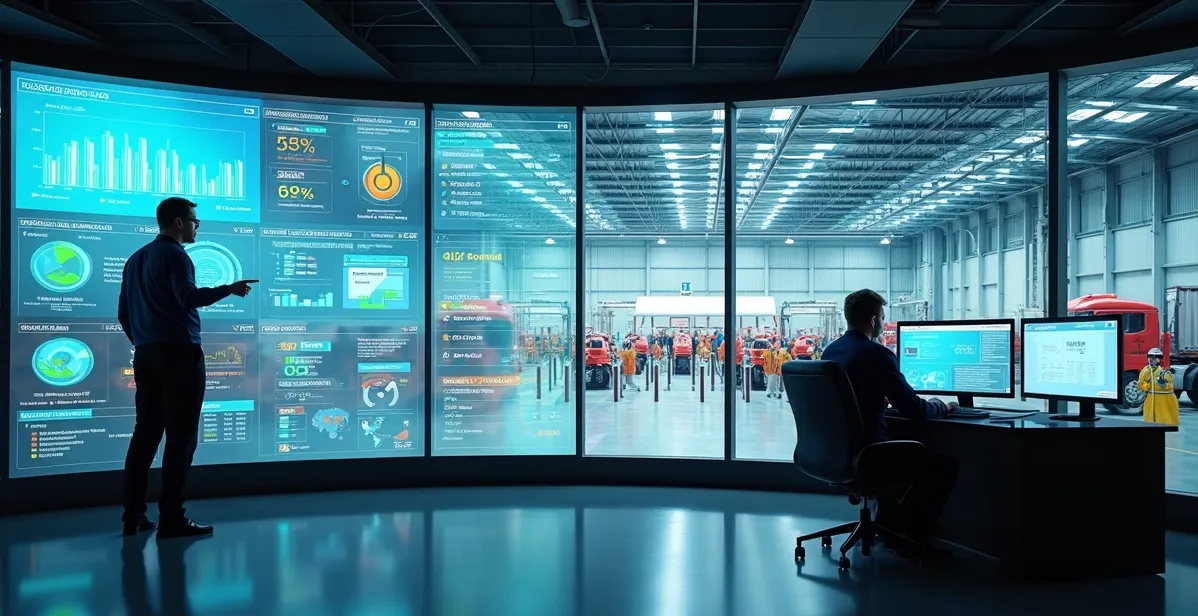
The use of risk dashboards has transformed the way industrial managers track operational and compliance risk. In environments with intense circulation of third parties, contractors and vehicles, running effective audits without clear visual data is a challenge.
In the world of large industrial operations, where multiple suppliers interact across different shifts and restricted locations, continuous monitoring is obligatory. Custom dashboards stand out by centralizing and translating complex indicators into clear, actionable information.
Take a look!
What is the role of risk dashboards in industrial audits?
Visualizing risk through dashboards is an efficient way to map and prioritize critical points during audits. An operation that depends on the constant entry and exit of outsourced professionals needs to ensure every access event complies with safety standards and labor legislation.
These visual reports not only present charts on indicators such as expired documents or outstanding training but also make it easier to identify patterns and trends.
That way the auditor can anticipate problems and act before failures occur. Consider the following scenarios:
- Monitoring of contractors with irregular documentation
- Alerts for vehicles without access authorization
- Real-time tracking of compliance levels by department
Tools such as those developed by RainbowTec integrate these reports into the manager's routine, bringing speed to periodic or extraordinary audits.
Defining the dashboard's objectives and scope
Every industry has its own operational and regulatory reality. Before building any visual dashboard on risk, you have to answer:
- What will be audited? (documentation, access, safety, health…)
- Which areas, teams or contractors are in focus?
- How will the data be used: daily management, annual audit, reporting to the board?
With those answers, you design a lean scope, avoiding an excess of information and scattered focus. A good risk dashboard offers fast answers to what genuinely matters for the operation.
Selecting relevant indicators and KPIs
Indicators are the heart of any dashboard. To be useful, they need to be selected for their relevance and availability. The most common for industrial environments include:
- Percentage of contractors with expired documentation
- Average time to resolve nonconformities
- Number of access blocks per month
- Incidents recorded by area or shift
- Visits awaiting approval
- Compliance with protective equipment and mandatory training
The secret lies in prioritizing KPIs aligned with the main risks of the business. A good example cited by the RainbowTec team is automatic tracking of licenses and document validity, avoiding surprises in inspections.
Integrating data in the cloud and continuous updating
A dashboard's efficiency depends on the quality and freshness of the data feeding it. Cloud systems offer advantages such as:
- Centralization of information (people, companies, vehicles, protective equipment…)
- Dynamic updating (new access events and approvals are reflected within seconds)
- Automatic access restrictions based on document status
- The possibility of integrating with turnstiles, barriers and IoT devices
On the basis of that active, automated data flow, the dashboard becomes a living tool, reflecting the real position of risk at every instant.
Solutions such as RainbowTec's highlight the possibility of self-service for suppliers, AI for document validation and integration with physical control equipment, making monitoring more effective with less manual rework.
Customization and adaptation to the business context
Different sectors demand distinct views of risk. That is why the visual components and reports have to be adapted to the audience concerned:
- The board looks for comparisons and trends
- Supervisors want instant nonconformity alerts
- Auditors analyze the full history of access, blocks and records
Beyond that, the dashboard needs to be responsive, allowing viewing on multiple devices and export of the data whenever requested. Companies such as RainbowTec offer modular dashboards, where each unit chooses the KPIs that best suit its operational routine.
What are the practical stages for building custom dashboards?
Building an efficient dashboard can be divided into clear stages:
- Mapping priority risks: Analysis of audit and previous inspection records to identify where the greatest risks and bottlenecks are.
- Defining KPIs and metrics: Choice of indicators that are clear, measurable and easy to audit, such as records of unauthorized access or incident response times.
- System integration: Use of cloud applications that bring together data from internal systems, turnstiles, gates and third-party self-service portals.
- Visual configuration: Choice of charts, traffic lights, lists or visual risk maps that make for fast reading and decision-making in audits.
- Continuous updating and maintenance: A routine of reviewing the dashboards with the inclusion of new indicators, as the needs and risks of the business change.
By following that step-by-step, you ensure results adapted to the reality of each industrial operation.
How do custom dashboards support compliance?
Well-structured dashboards make it possible to audit compliance automatically. Imagine receiving an instant notification whenever a contract is close to expiring or when a contractor fails to submit a mandatory document. That reduces human error and brings forward the resolution of outstanding items.
Beyond that, these reports make dialogue with regulators easier, since all the records are centralized and accessible. The RainbowTec team points out that integrating access data with automatic document checking eliminates rework and mitigates legal risk in audits.
Continuous updating: the secret of efficient control
Industrial environments are highly dynamic. Procedural changes, regulatory shifts and new external requirements appear regularly. That is why dashboards need to be reviewed and to evolve, never sitting still.
A recommended practice is to establish monthly or quarterly routines to review indicators, update display formats and incorporate user suggestions. That way the dashboard does not merely keep up with the business but becomes a long-term partner in risk management and auditing.
Custom risk dashboards have become strategic allies for industrial audits, particularly in operations with heavy circulation of third parties and contractors. They allow you to act quickly, reinforce compliance and bring transparency to the risk picture.
By combining cloud technology, automatic updating and custom indicators, solutions such as RainbowTec's deliver tools that go beyond traditional reports.
If the idea is to protect your operation and take better decisions, creating and maintaining custom dashboards can transform the way you see and respond to the daily challenges of industry.
Share this article on social media and help more managers learn the advantages of custom dashboards, cloud management and integrated security!
Frequently asked questions
What are industrial risk dashboards?
Industrial risk dashboards are visual tools that gather and organize data on the main risk factors in factory environments, such as third-party documentation, access and compliance with standards. They serve to support audits, decision-making and fast incident response by showing, through charts or alerts, the status of the controls implemented in the operation.
How do you create a custom risk dashboard?
To create a risk dashboard suited to your reality, the manager should start by mapping the risks most relevant to the industry. Next, define genuinely useful KPIs, integrate cloud data sources and choose visualizations that suit audit routines. The ability to customize indicators and reports ensures better results, as examples practiced by RainbowTec show.
Which data should you use in risk dashboards?
The most common data involves document validity, access granted or blocked, history of occurrences, training deadlines and records of protective equipment. It is fundamental that the information is updated in real time and linked both to third parties and to the company's own workers and vehicles circulating in the industrial unit.
Why implement risk dashboards in audits?
With a visual dashboard, auditors and managers gain speed in identifying weak points, anticipating failures and prioritizing corrective action. These dashboards also centralize data, making internal and external audits easier, reducing legal risk and organizing the necessary documentation automatically.
Which tools make building these dashboards easier?
Cloud applications such as those provided by RainbowTec make the process more practical by integrating multiple systems and data sources. Other useful features are self-service for third parties, automation of document validation through artificial intelligence, and integration with physical access control equipment.